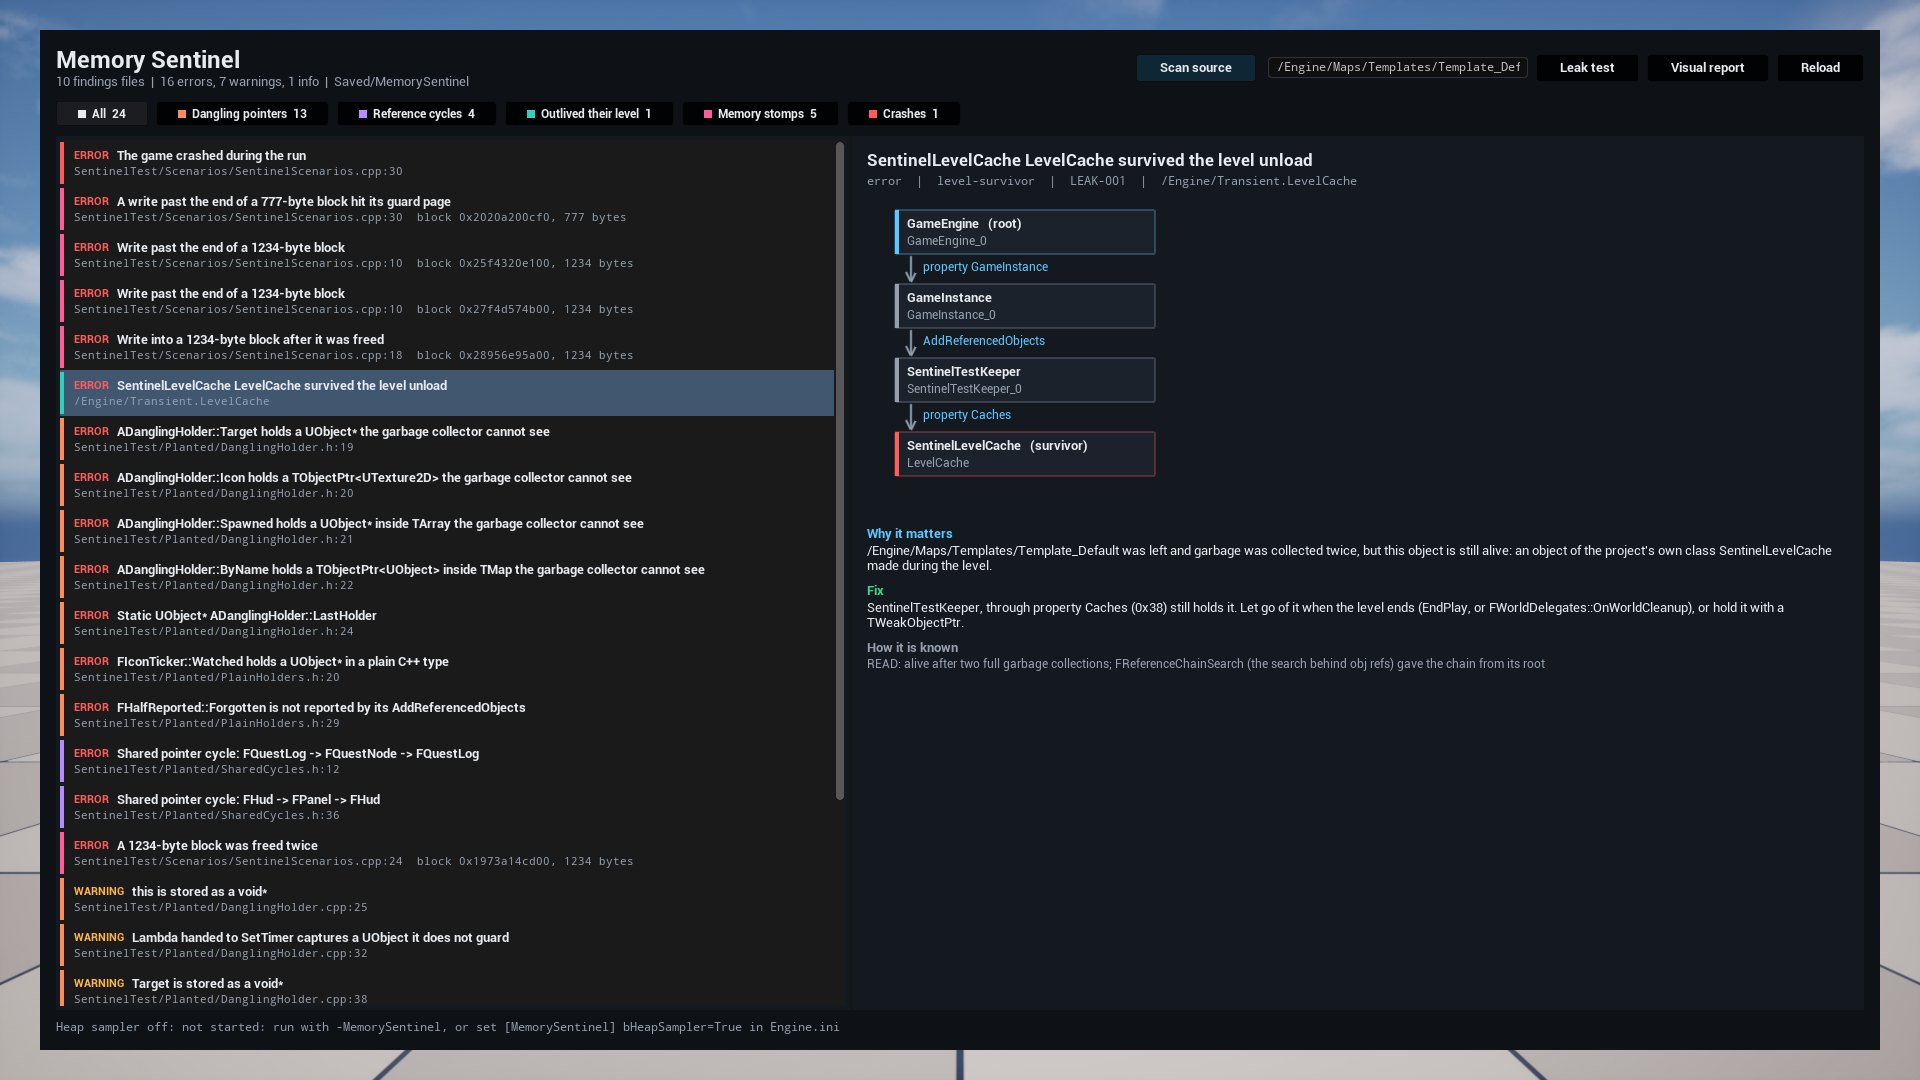
Find Unreal memory bugs before your players do. UObject pointers the garbage collector cannot see, shared pointer cycles, objects that outlive their level, and writes past the end of a block or after it was freed, each with the line, the reason, how it is known and what to change.
The panel running inside Unreal, here as the in-game overlay (ms.Show). The editor tab is the same widget. A captured frame from the test game, not a mock-up.
Install in one click
Unzip it, double-click Install-MemorySentinel.cmd and pick your .uproject. The installer copies the plugin into Plugins/MemorySentinel, moves an older copy to a dated backup, adds the plugin to your project file and changes nothing else in it, then tells you what it did. Open the project and accept the rebuild. Unreal 5.7, Windows x64, C++ projects.
Or let your AI assistant do it: paste the prompt in AI_INSTALL.md (also in the zip) into Claude Code, Copilot or Cursor, opened in your project folder. It installs, builds, scans and walks you through each finding with its file and line.
01Four bugs, and how each one happens
Each card is a working model of one bug. Press the buttons and watch what the engine does. The panel and the report draw the same pictures for real findings.
A UObject pointer the collector cannot see
C++ has no runtime reflection. Unreal Header Tool reads UPROPERTY and writes the list of references the garbage collector walks. A raw pointer without it is not on that list: the collector frees the object, and the pointer still holds its address.
The collector starts at the roots and follows only the references Unreal Header Tool listed.
A shared pointer cycle
TSharedPtr is a reference count. When two objects hold strong pointers to each other, neither count can reach zero after everything else lets go, so both stay in memory forever. One side has to be a TWeakPtr.
The quest screen holds the log; the log holds its nodes; each node holds the log back.
A write past the end of a block
A sampled block gets a canary: known bytes right after its end. A data breakpoint, one of the CPU's four debug registers, watches the first word of the canary. The write that touches it stops on the spot, so the report names the exact line.
A 12-byte block, then its canary (to the next 8-byte boundary, and 16 more). DR0 watches the canary's first whole 8-byte word.
An object that outlives its level
Leaving a level should free what it made. Something that lives longer, a subsystem, a static, a cache, keeps one reference, and the object (and everything it holds) stays. The leak test leaves the level, collects garbage twice and asks the engine who still holds each survivor.
The level made three actors and a cache. A game instance subsystem keeps the cache in an array.
02The live report
This is a real report, drawn by the same viewer the plugin writes into report.html. The findings come from the plugin's test game, which plants each bug on purpose beside a clean copy of the same pattern. The files are as the runs wrote them, with this machine's folder names shortened. Pick a finding to see its evidence; the detector runs, with what each one checked and cannot see, are at the bottom.
03How it works
Three detectors, one findings format, and two ways to read it. Every finding says how it is known: where the declaration was read, which engine search found the chain, which bytes changed. A detector that could not run says so and never reports a clean pass.
Static pass
Reads the project's own Source/ and its plugins' Source/, with comments and strings blanked so neither can match. It indexes every class and struct with its reflection macro and bases, reads each member declaration, and reports:
raw UObject*, TObjectPtr or containers of them with no UPROPERTY and not in the class's AddReferencedObjects;
static UObject pointers, and TSubclassOf without UPROPERTY;
UObject pointers in plain structs, and FGCObjects that forget a member;
lambdas handed to timers, delegates and tasks that capture this or a UObject unguarded;
UObjects cast or assigned into void*;
TSharedPtr cycles between types, through base classes too, naming the side to weaken.
Level leak test
Records every live object, opens the map, lets it run, opens the return map and collects garbage twice. A survivor is anything that belonged to the map's package or world, an actor or component in no live world, or an object of the project's own classes made during the level.
For each survivor, the engine's own reference search (FReferenceChainSearch, the code behind obj refs) gives the shortest chain from a root, each link with the property or AddReferencedObjects that holds the next object.
Heap sampler
With -MemorySentinel, a proxy wraps the engine's allocator at startup. One allocation in N (256 by default), and every allocation of a suspect size, gets 16 to 23 bytes of canary and a recorded stack. Its reported size stays the size asked for.
Canaries are checked on free and on a per-frame budget. Freed blocks wait in quarantine filled with a pattern, so a late write lands in memory nothing else owns. A corrupted block's size becomes a suspect.
Four registers, many blocks: the rotation
The CPU can watch only four addresses at once (DR0 to DR3, up to 8 bytes each), and the watch costs nothing. So the sampler rotates them: every few frames a rotor thread picks four words, suspect-size canaries first, then suspect blocks in quarantine, then the newest samples, and loads them into every thread. Over a run the watch moves across many blocks, and the one write that touches a watched word is stopped where it happens.
Guard pages, when you ask for them
With -MemorySentinelGuardEvery=N or -MemorySentinelGuardSizes=a,b, a sample of blocks sits right against a no-access page, as Google's GWP-ASan does. A touch past the end, or of a freed guarded block, faults at that instruction; the finding is written from the fault handler, then the game crashes there, on purpose. Off by default.
Things the engine taught us on the way
An engine flag that empties the search. In Unreal 5.7, FReferenceChainSearch's ExternalOnly mode tests each chain with a placeholder that always answers no and then removes every chain that failed it, so the search returns nothing. The leak test asks for Shortest only. See ReferenceChainSearch.cpp, PerformSearch, in your engine source.
The allocator's own write is not the program's. A watched block handed back to the engine's allocator gets the allocator's free-list pointer written into it, and a thread still holding the old watch would report that write. A watched block never leaves quarantine while any thread may still be watching it.
A level's own components are not leaks. Each world makes its line-batch components in the transient package. The first test run reported the new world's as survivors; a survivor must now be outside every live world.
04Plug it into your project
Run the one-click installer, or by hand: download the plugin and unzip it into your project, so you have Plugins/MemorySentinel/. It is a source plugin for a C++ project (Unreal 5.7, Windows x64).
Regenerate project files and build your editor target. The plugin adds three modules: MemorySentinelHeap (loads early, wraps the allocator only when asked), MemorySentinel (leak test, findings, panel) and MemorySentinelEditor (the tab).
Open Tools > Memory Sentinel. Scan source runs the static pass with the Python that ships inside Unreal; Leak test opens the map in the box, leaves it, and lists what survived (in the editor it runs in a separate, windowless game process, so your editor world is never touched); Visual report builds report.html and opens it. Double-click a source finding to open your IDE at its line.
For the heap sampler, start the game with -MemorySentinel, and add -MemorySentinelSuspectSizes=1234 once a report names a block size: every block of that size is then sampled and watched first.
Have Claude install it
Paste this into a terminal in your Unreal project's folder. It starts Claude Code with the install as its first task.
claude "Install Memory Sentinel into this Unreal project: download https://rj45thompson.github.io/anchor-demo/memsentinel/MemorySentinel-UE5.7-v1.0.zip and unzip it into Plugins/, build the editor target, then run the engine's Python on Plugins/MemorySentinel/Content/Python/ms.py scan . and walk me through what it found."
The engine's own Python is at Engine/Binaries/ThirdParty/Python3/Win64/python.exe; any Python 3.9 or newer works. Exit codes: 0 nothing at or above --fail-on, 1 findings, 2 the detector could not run (no source, the map did not load, the run wrote nothing). A crashed run becomes a finding of its own, with the crash stack.
05Reference
Command line switches (game)
-MemorySentinel
Wrap the allocator and start the heap sampler (or [MemorySentinel] bHeapSampler=True in DefaultEngine.ini).
-MemorySentinelSampleEvery=N
Give one allocation in N a canary. Default 256.
-MemorySentinelSuspectSizes=a,b
Sample every block of these sizes and watch them first. Up to 16 sizes; a corrupted block's size is added on its own.
-MemorySentinelGuardEvery=N
Put one allocation in N (up to 4 KB) against a no-access page. Off by default.
-MemorySentinelGuardSizes=a,b
Put every block of these sizes against a guard page.
-MemorySentinelTable=N
Sampled blocks tracked at once. Default 65,536; a full table pauses sampling, and the report counts what it skipped.
For scripted headless runs: a screenshot with the panel, a delayed command, a timed exit.
Reading a finding
Every detector writes the same JSON to Saved/MemorySentinel/: what it checked (so a clean run can be told from one that did not run), what it cannot see, and its findings. Each finding has a rule, a severity, where (file and line, or an object or block), why, a fix, how it is known and its evidence (the chain, the cycle, the bytes, the stacks). To accept a static finding on purpose, put // memsentinel: ignore <reason> on its line or the line above; it stays in the report as suppressed, with the reason.
06Measured
On the test game, where every bug is planted beside a clean copy of the same pattern:
18 of 18planted static bugs reported at their own lines; 0 reports in the clean folder
1 of 1planted level leak found, with its chain from the engine's root; 0 survivors with nothing planted, out of about 43,000 live objects
5 of 5planted heap bugs found: overrun, overrun freed in the same frame, write after free, double free, guarded overrun
0heap findings with nothing planted: 19 million allocations, 67,355 canaries, 5,067 guard pages, 27 rotations, two map travels
The overrun and the write after free are stopped by a data breakpoint at the exact writing line; the guarded overrun faults at its line. The tool was checked against the rules it was built from with a spec check: 13 rules quoted word for word from the design notes, one small program per rule run against the shipped tool, every rule kept. Three faults planted in a copy of the tool (a reader that ignores missing UPROPERTY, a graph that counts TWeakPtr as strong, a run that never switches the sampler on) each turned their programs red, so the checks can fail.
On code we did not write
The static pass, run on seven of Epic's plugins that ship with Unreal 5.7 (Gameplay Abilities, Common UI, Enhanced Input, Modular Gameplay, Game Features, Common Conversation, Gameplay State Tree: 763 files, 170,027 lines), reports 19 errors, 57 warnings and 6 info. We read every error by hand: in each, the collector really does not see that pointer (no UPROPERTY, and not reported by the class's AddReferencedObjects). Most are safe in practice because something else holds the object, or the set is cleared every tick; that judgement is the person's, which is why every finding can be suppressed with a reason. The plugins' source is in every Unreal install, so this can be repeated: ms.py scan "Engine/Plugins/Runtime/GameplayAbilities".
Not measured yet: the heap sampler's cost in frame time, and how often a rotation catches a stomp nobody planted. The numbers above are one run each.
07What it cannot see
Every findings file lists its own blind spots. In short:
Static pass
Only the project's own source: engine code, engine plugins and generated code are not read.
Pointers behind a type alias or written by a macro are not followed.
Cycles that only form at runtime; a type that holds its own type is listed as info.
Whether a plain struct lives across a frame (short-lived ones are safe).
Level leak test
Only what the run played; paths the level did not reach are not exercised.
A dangling raw pointer keeps nothing alive, so this test cannot see one.
The shortest chain to a root; another chain may hold the same object.
Heap sampler
Only sampled blocks, and only writes: a read after free is caught only on guarded blocks.
Four 8-byte words at a time, on threads that existed at the last rotation.
Blocks allocated before the plugin loads, or larger than 1 MB, are never sampled.
A debugger that owns the debug registers turns the rotor off (it says so).
08Prior art, and where this fits
No single tool does all of this, and Memory Sentinel does not replace the ones below; it puts their questions in one place and asks them on every run.
DR0 to DR3 and DR7, described in Intel's Software Developer's Manual (volume 3, debug features). Windows sets them per thread with SetThreadContext; the hit arrives in a vectored exception handler.